
Debug Streaming Like a Pro: Visual Tracing and Rapid Iteration
📎 Did you know? The vast majority of real-time streaming data pipeline bugs only reveal themselves under production workloads, usually at 03:00 am. Because streaming systems process unbounded data in memory, traditional breakpoints and step-through debugging are impossible without stopping the entire world, corrupting states, and causing downstream disaster.
The Concept of Visual Tracing
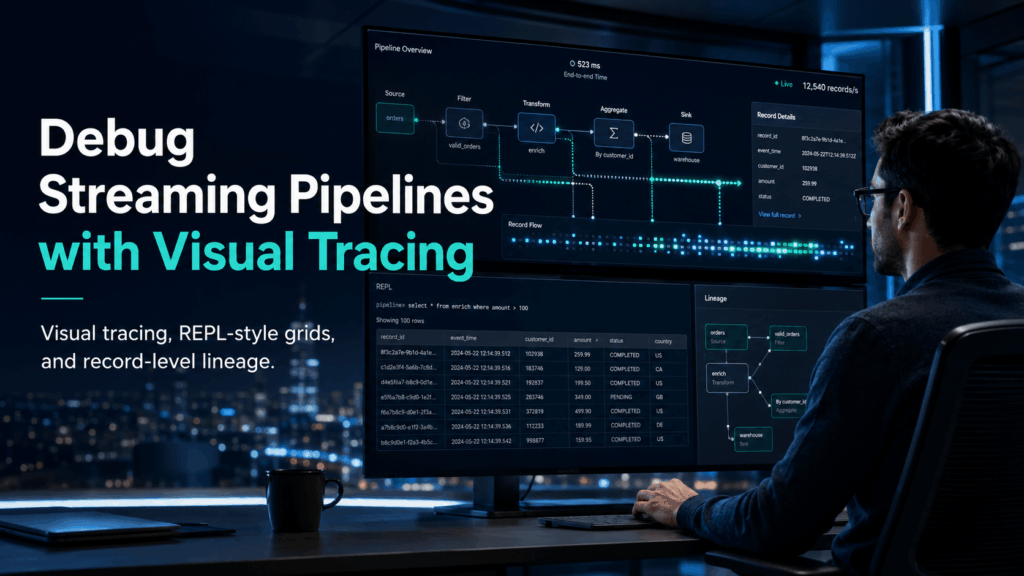
Streaming debugging is notoriously complex. Unlike batch processing, where you can pause, inspect, and rerun a static chunk of data, streaming flows constantly. Visual tracing changes this entirely. It acts like a high-speed camera for data-in-motion, allowing data experts to map out data flows and evaluate execution blocks in real time. Instead of looking at unformatted command-line error logs, engineers can see records moving through transformations interactively, mimicking Read-Eval-Print Loop (REPL) interactive grids.
Streaming Bottlenecks for Modern Enterprises
Building real-time data architectures, like Kappa or Lambda models, presents massive operational challenges for businesses:
- The Black Box Dilemma: When an aggregate metric spikes or a schema drifts, finding the exact corrupted record or broken joint downstream requires hours of parsing log files.
- Sluggish Iteration Cycles: Testing a minor business logic adjustment or custom Python snippet often requires full redeployment to a remote Apache Spark or Apache Flink cluster, dragging out development phases from days into weeks.
- Late-Arriving Records & Drift: Data arriving out of order or unexpected upstream structural modifications can silently break hand-written stateful transformations, resulting in inaccurate real-time dashboards and broken business trust.
The IOblend Solution
To overcome these production bottlenecks, IOblend shifts the entire streaming paradigm by embedding built-in DataOps directly into a low-code visual environment. Running on a highly optimised Kappa architecture, IOblend autogenerates distributed Apache Spark streaming jobs without requiring manual code.
For data experts debugging complex streams, IOblend provides specific, production-ready capabilities:
- Visual Debugging & REPL Grids: Test real-time data flows locally via an interactive developer desktop application with REPL-like data grids, allowing you to iterate instantly before pushing pipelines live.
- Granular Record-Level Lineage: If an error occurs, IOblend tracks data changes down to the individual record, exposing exactly what modified the data.
- Automated Drift & Late Data Handling: It automatically tracks schema evolution, protects data contracts, and seamlessly replays transforms whenever late-arriving data hits the engine.
Simplify your pipelines and scale with confidence by leveraging the real-time observability of IOblend.

Saving Cents on Data Sense: Less Cost, More Value
No company is immune from the pains of data integration. It is one of the top IT cost items. Companies must get on top of their integration effort.

Operational Analytics: Real-Time Insights That Matter
Operational analytics involves processing and analysing operational data in “real-time” to gain insights that inform immediate and actionable decisions.

Deciphering the True Cost of Your Data Investment
Many data teams aren’t aware of the concept of Total Ownership Cost or its importance. Getting it right in planning will save you a massive headache later.

When Data Science Meets Domain Expertise
In the modern days of GenAI and advanced analytics, businesses need to bring domain expertise and data knowledge together in an effective manner.

Keeping it Fresh: Don’t Let Your Data Go to Waste
Data must be fresh, i.e. readily available, relevant, trustworthy, and current to be of any practical use. Otherwise, it loses its value.

Behind Every Analysis Lies Great Data Wrangling
Most companies spend the vast majority of their resources doing data wrangling in a predominantly manual way. This is very costly and inhibits data analytics.